Geovisualization Tools
2022/12/20
Editor
Geo Data Viewer
https://marketplace.visualstudio.com/items?itemName=RandomFractalsInc.geo-data-viewer
🗺️ Geo Data Analytics tool for VSCode with kepler.gl to gen. some snazzy 🗺️s w/0 Py 🐍 || pyWidgets ⚙️ || pandas 🐼 || @reactjs ⚛️ required ...
✅ Powerful data editing on GUI
✅ Preview and import open-sourced maps available on Kepler.gl
✅ View CSV and JSON data (not geodata) in grid charts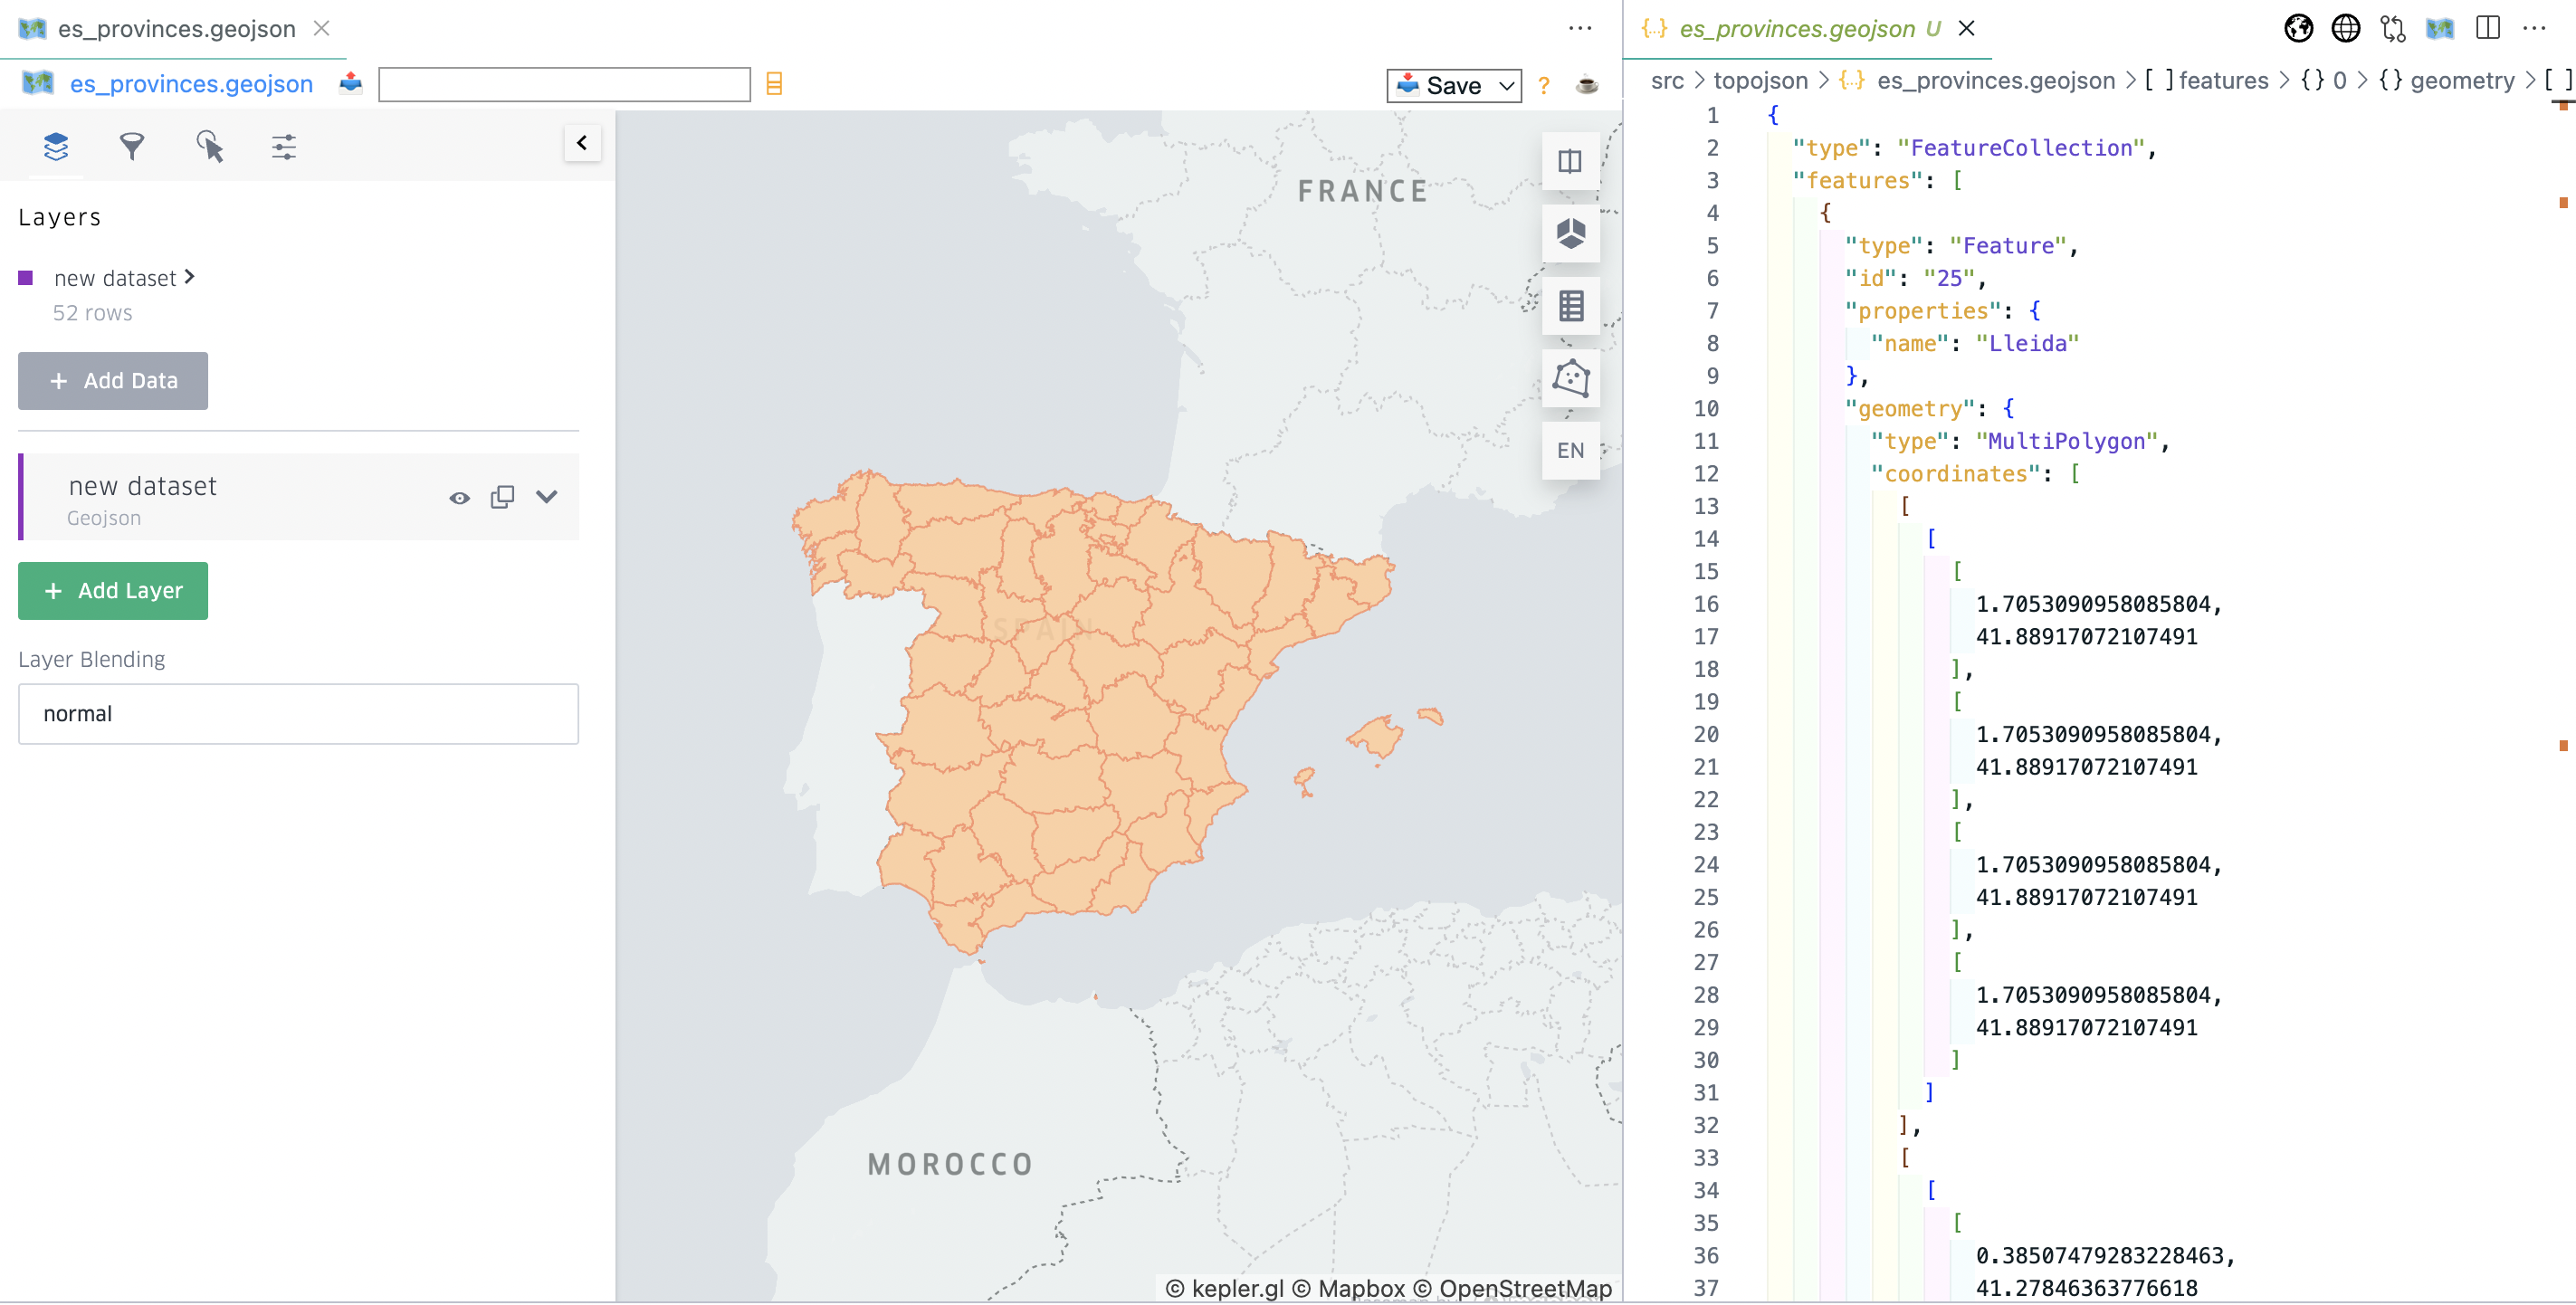
geojson.io
A quick, simple tool for creating, viewing, and sharing spatial data.
✅ Edit properties while seeing how it is displayed in the map.
❎ Merge polygons,
React Simple Map
https://www.react-simple-maps.io/
Create beautiful SVG maps in react with d3-geo and topojson using a declarative api.
✅ Preset visualizations (anotation, marker, choropleth map)
Vue SVG Map
https://www.npmjs.com/package/vue-svg-map
A set of Vue.js components to display an interactive SVG map.
✅ Bare minimum (polygons behave like radio-button / checkboxes), highly customizable
❎ Compatible with svg-maps or your own map
topojson
https://github.com/topojson/topojson
An extension of GeoJSON that encodes topology! 🌐
✅ Simplify, or manipulate topojson (merge, transform, calculate bounding box, ...)
Planetary.js
Awesome interactive globes for the web
✅ Create interactive globes
❎ Not maintained in this four years
Analytics Tool
Kepler.gl
Kepler.gl is a powerful open source geospatial analysis tool for large-scale data sets.
deck.gl
deck.gl is a WebGL-powered framework for visual exploratory data analysis of large datasets.
SDKs
QGIS
A Free and Open Source Geographic Information System
mapbox
Mapbox Studio is like Photoshop, for maps.
Flourish
https://flourish.studio/visualisations/maps/
Easily create stunning interactive maps with Flourish, the platform for data visualization and storytelling
HERE
https://www.here.com/solutions/data-visualization
Make your location data come to life. See complex trends and patterns by creating intuitive visualizations.
Tweet