First Step in Making Visualization - Which chart should I use?
2022/1/7
Choosing the right starting point for your visualization project isn't always easy. Here are some useful resources that help you pick the best one. 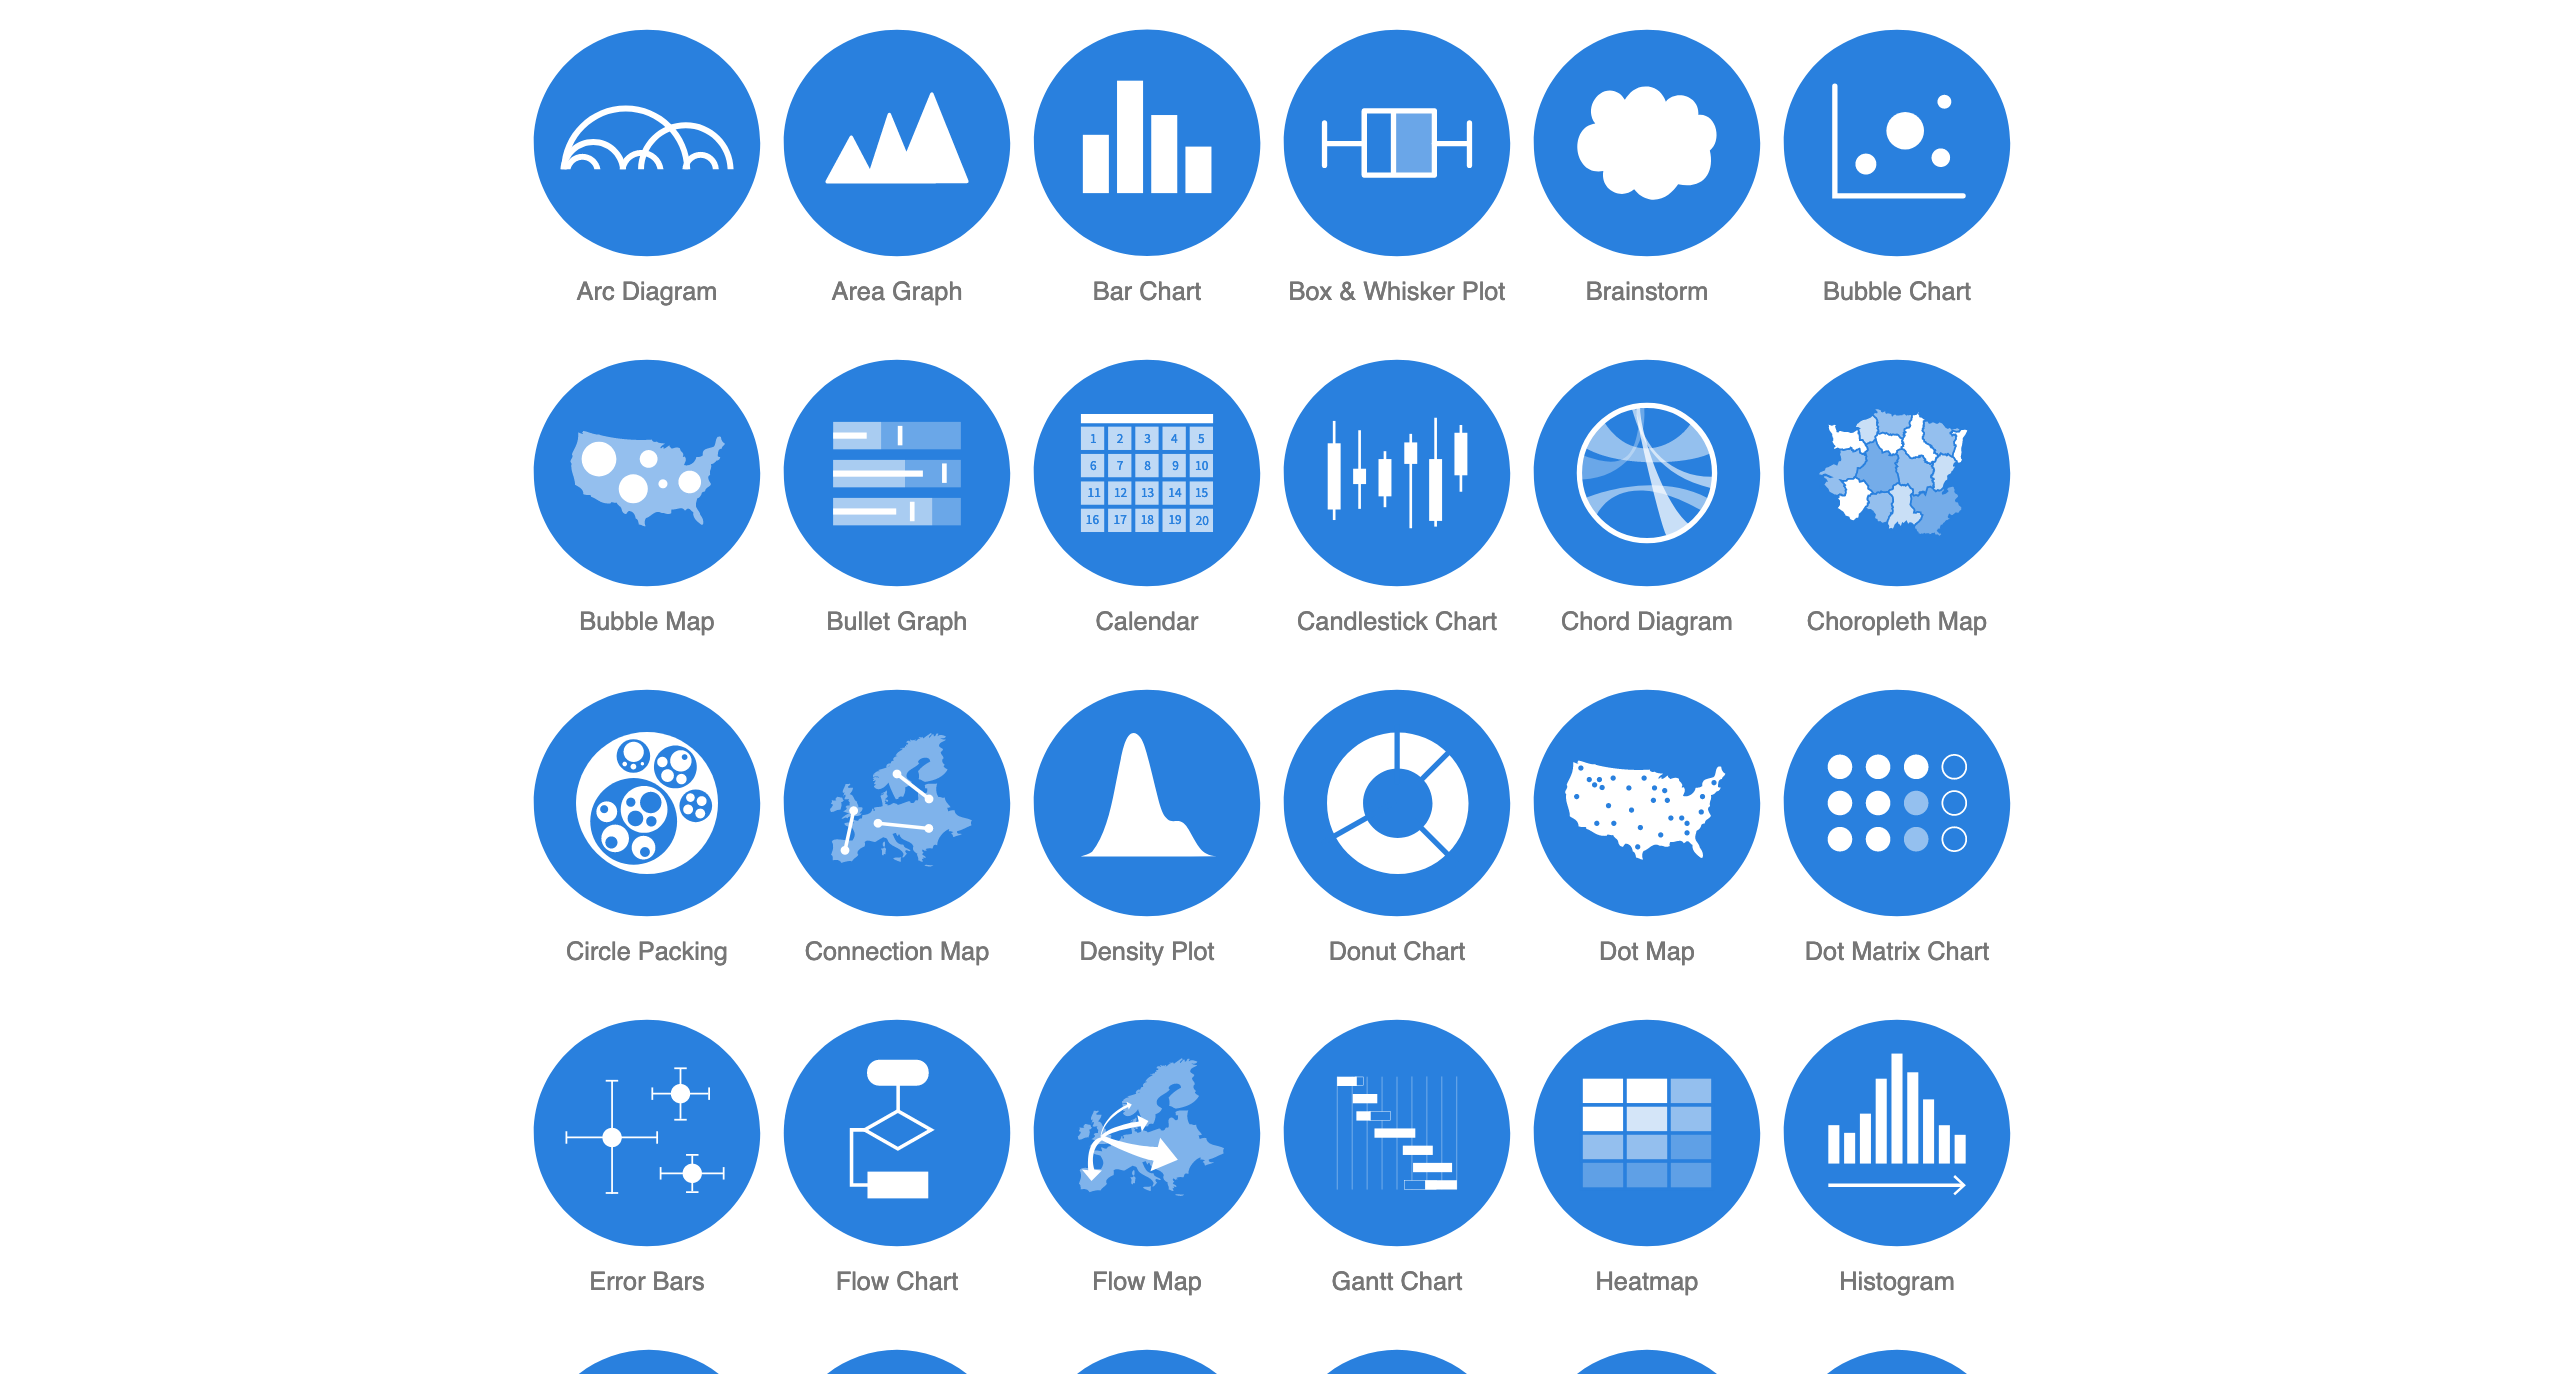
The Data Visualization Catalogue
A handy guide and library of different data visualization techniques, tools, and a learning resource for data visualization.
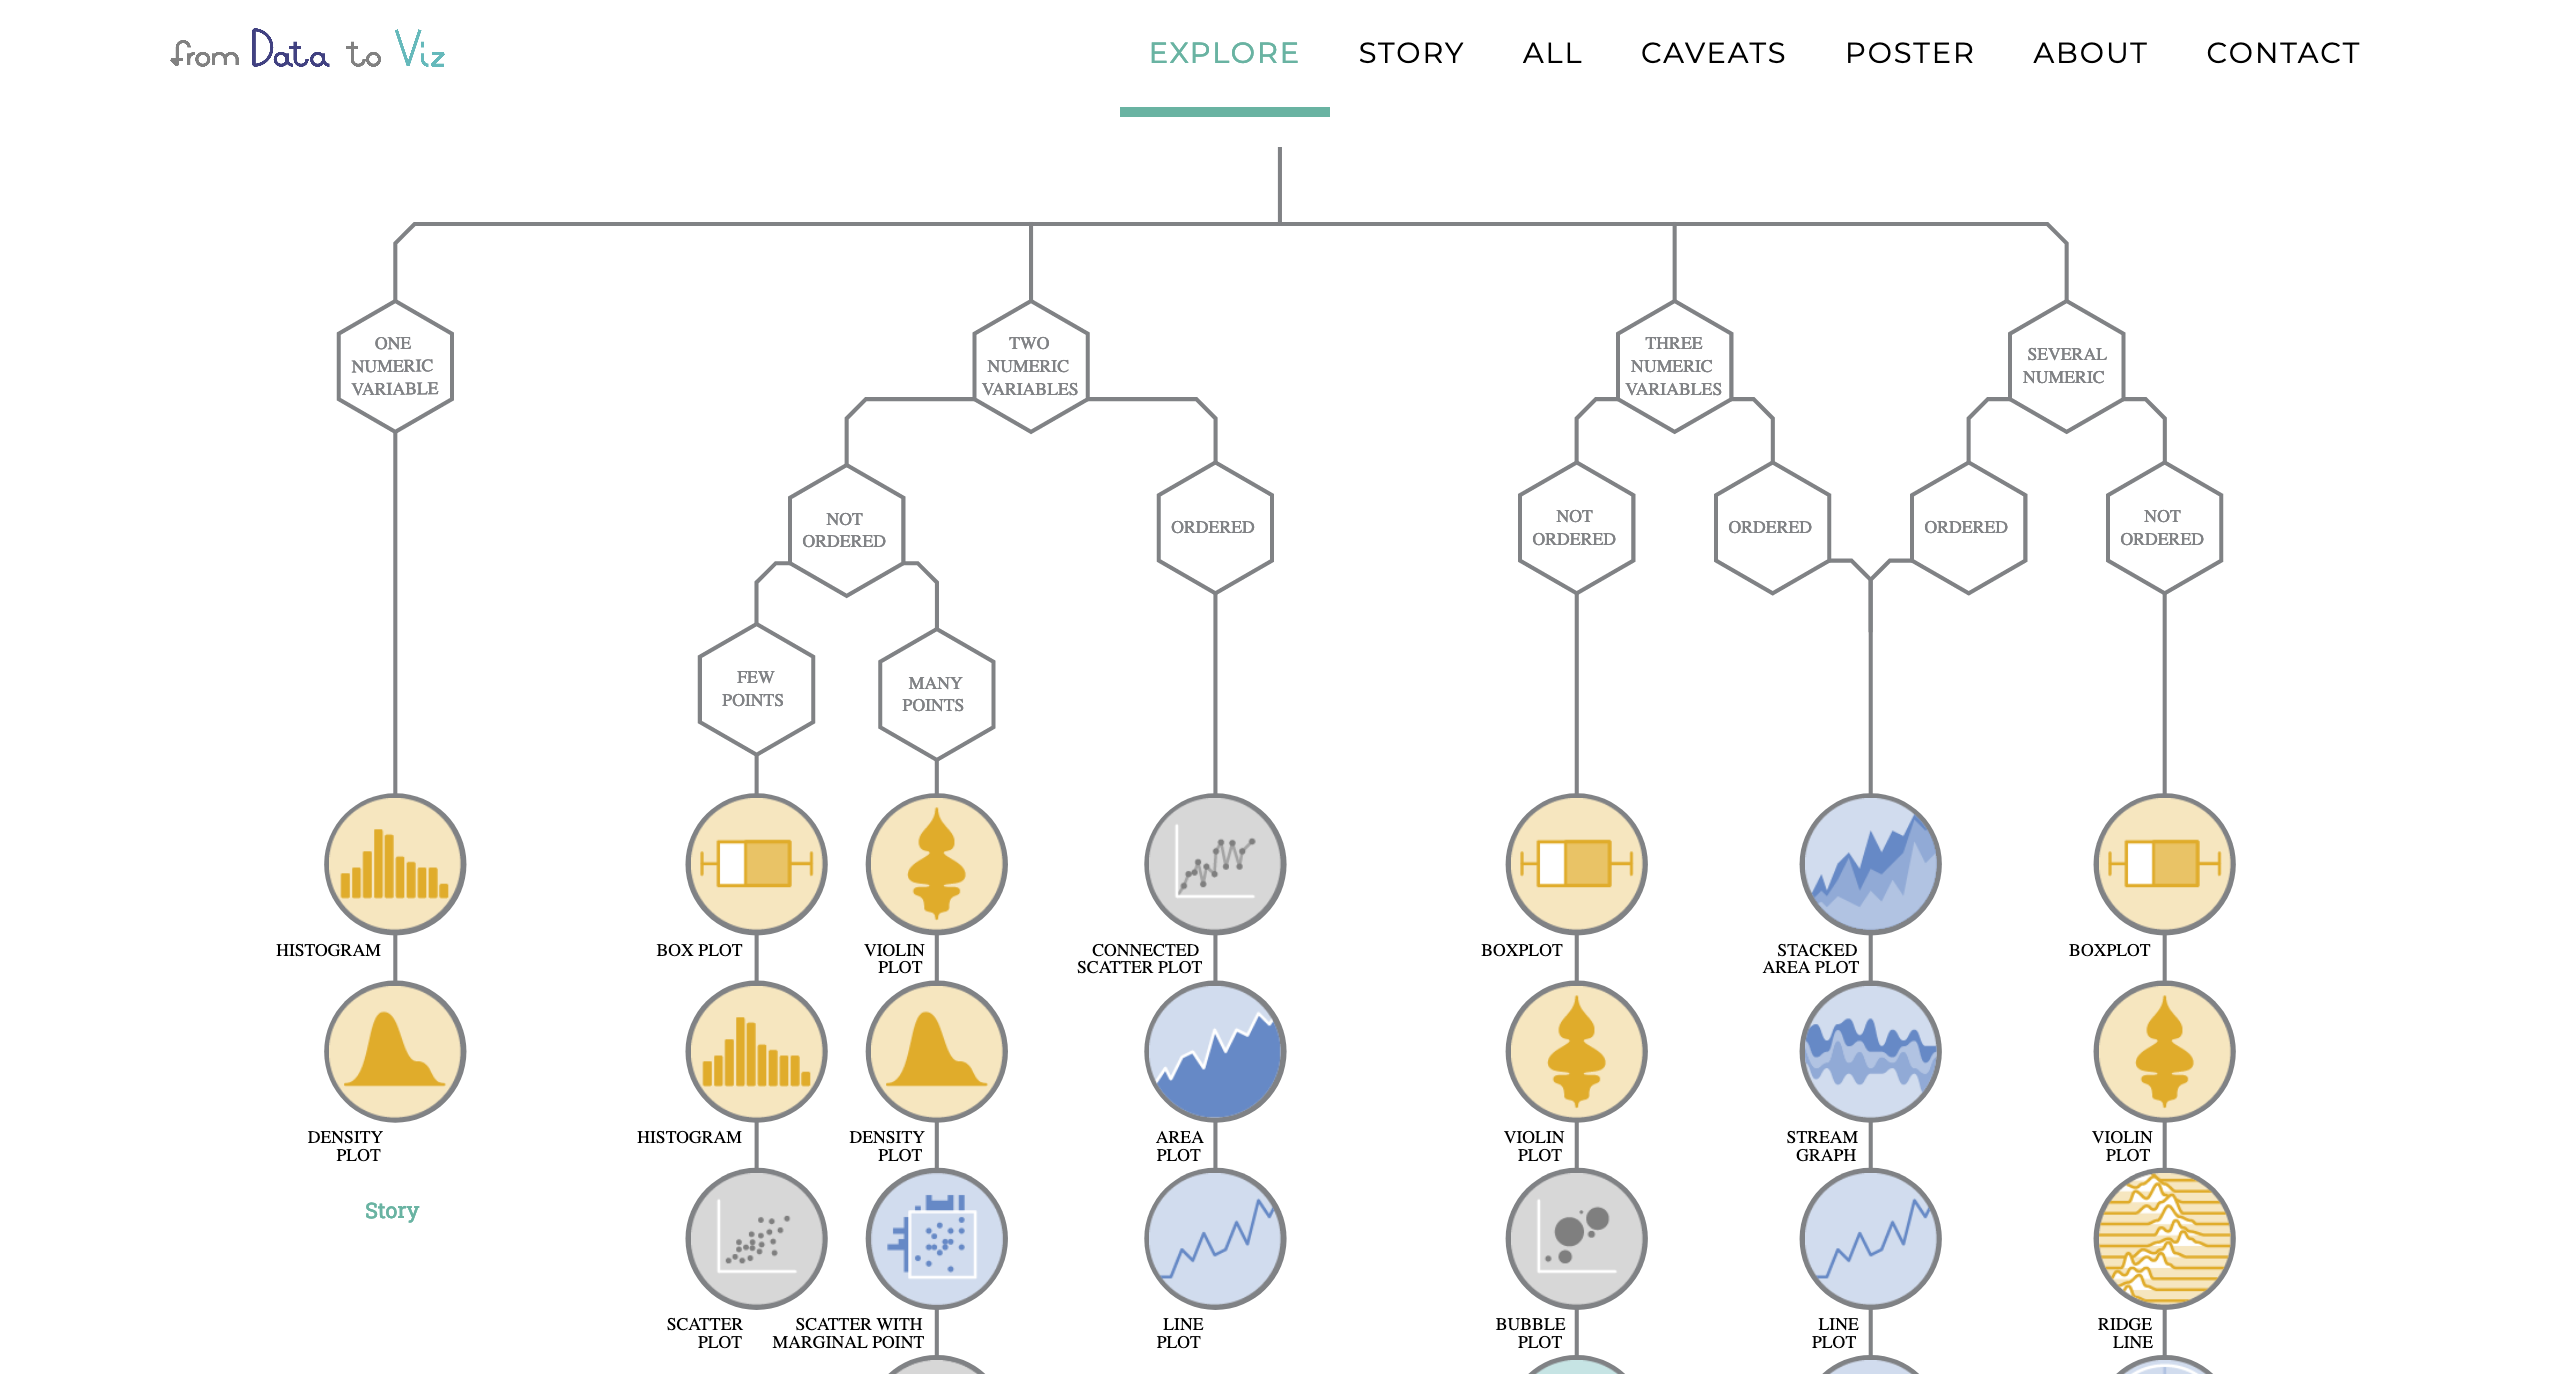
From data to Viz | Find the graphic you need
A classification of chart types based on their input data format.
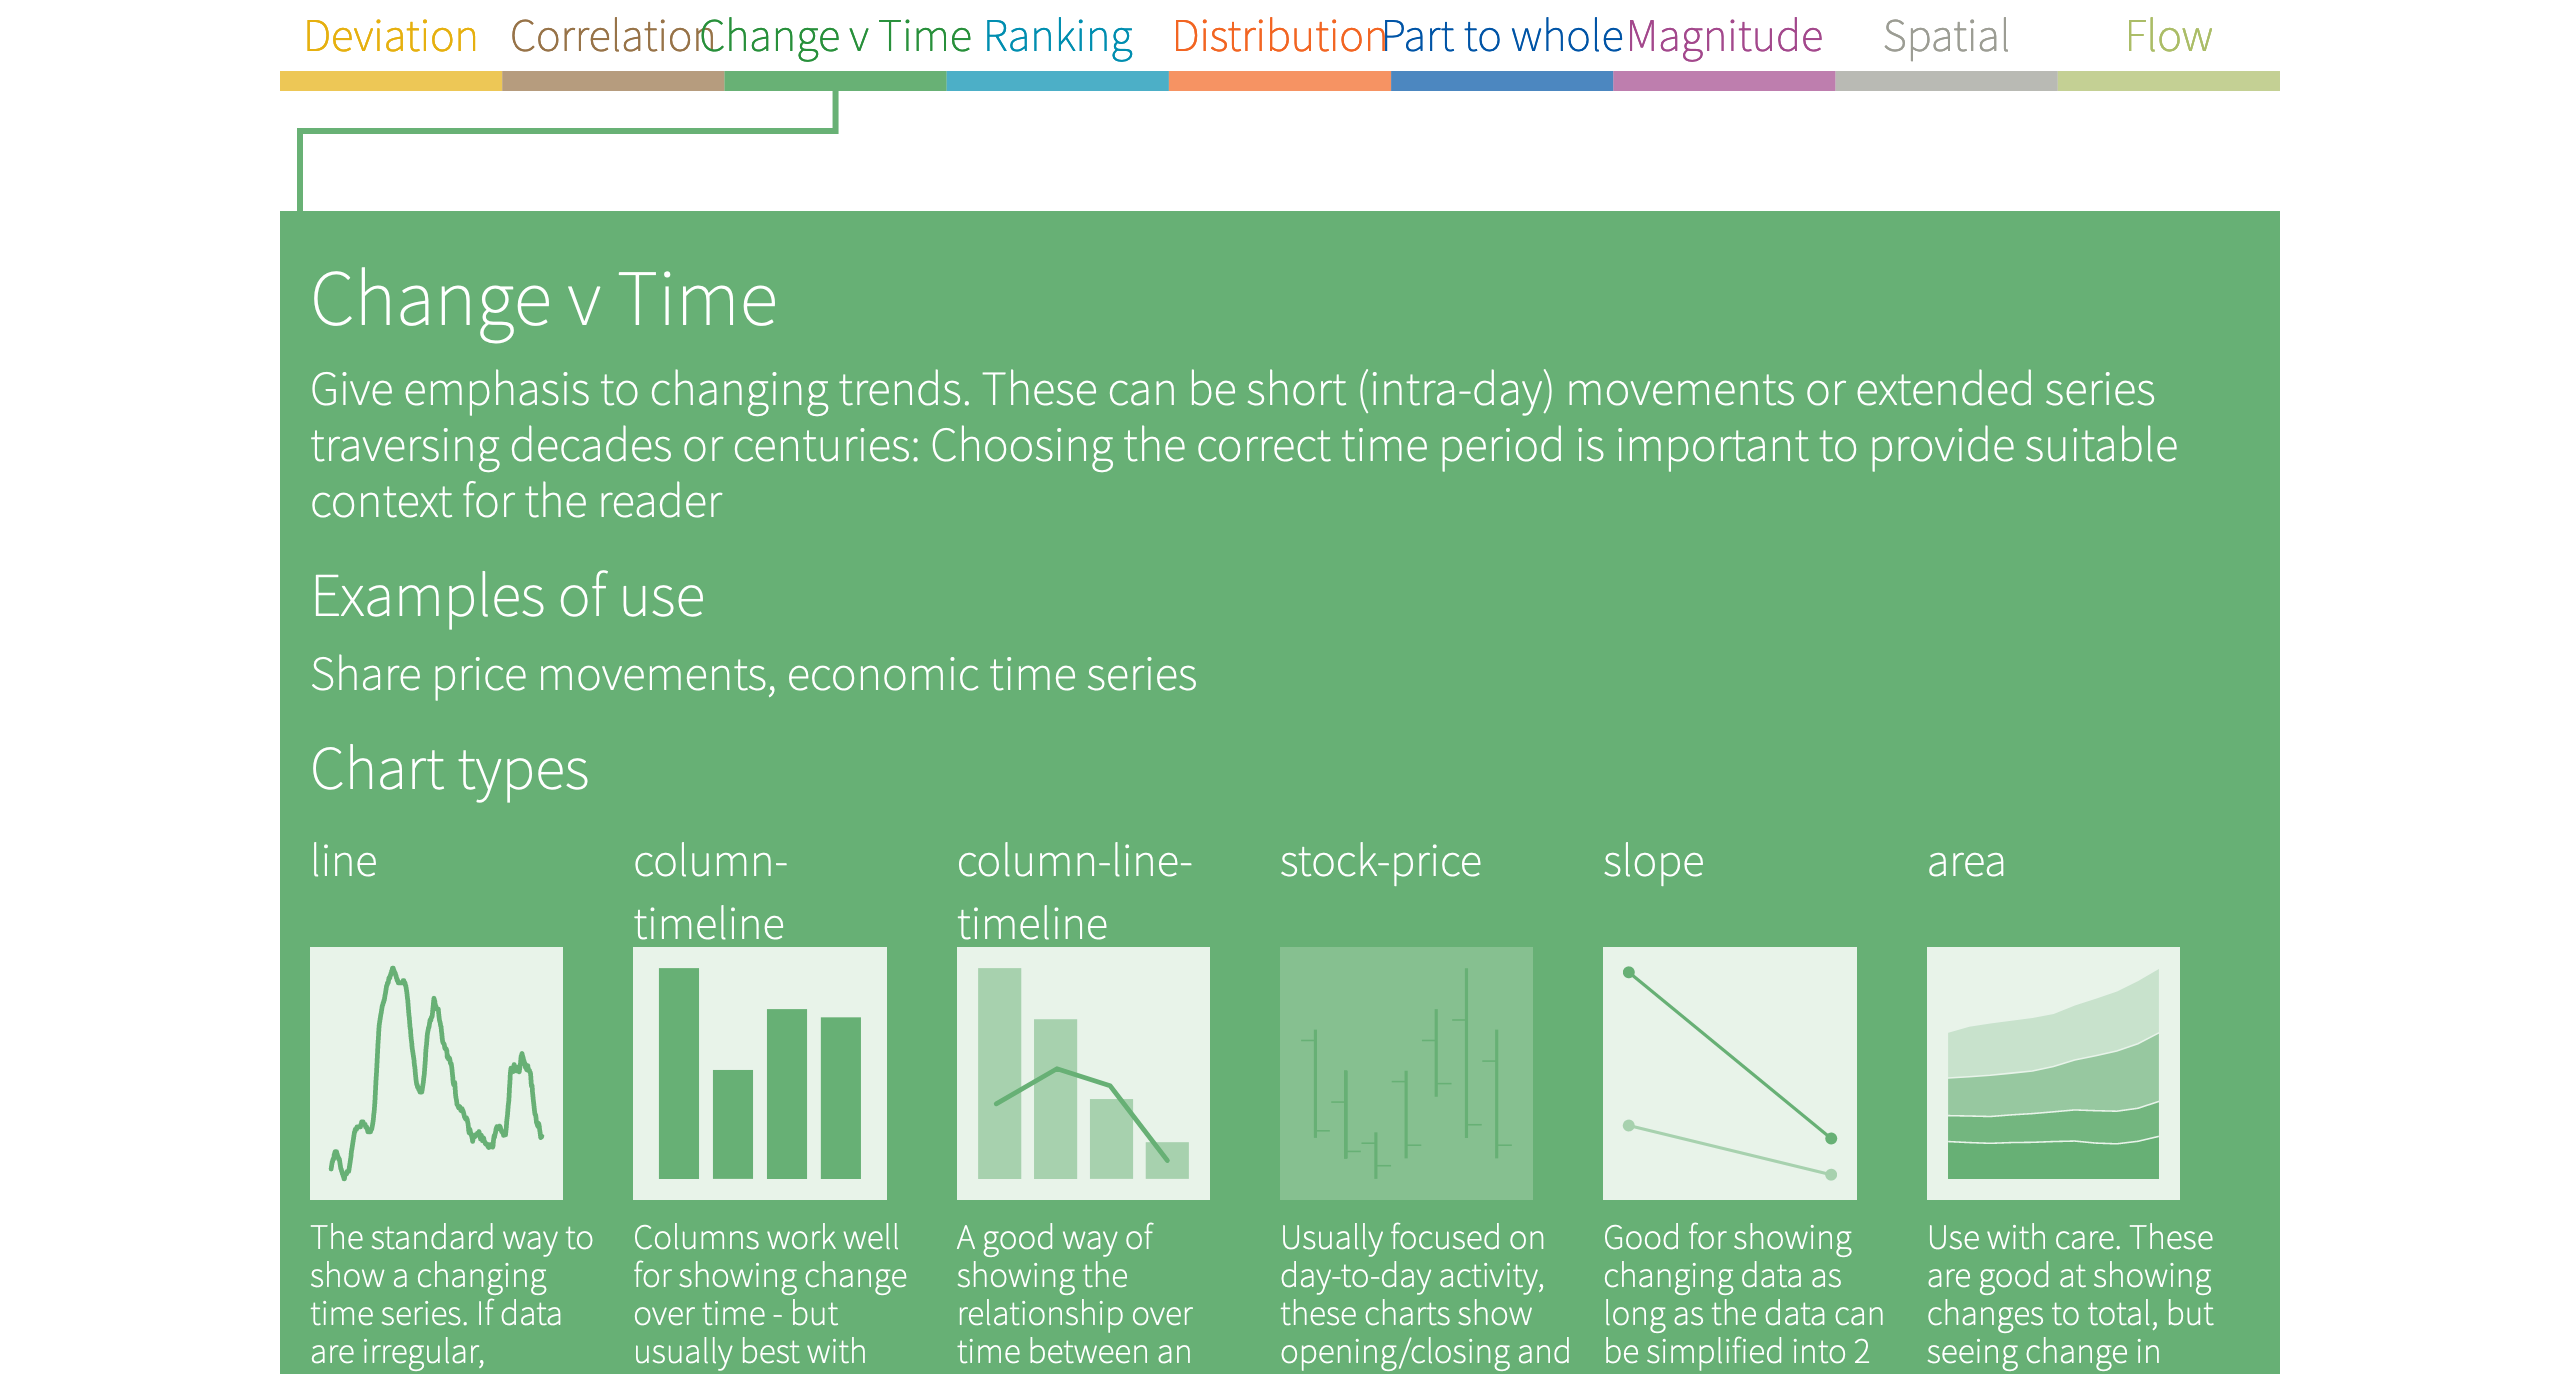
FT Visual Vocabulary
There are so many ways to visualise data – how do we know which one to pick? Click on the coloured categories below to decide which data relationship is most important in your story, then look at the different types of chart within the category to form some initial ideas about what might work best. This list is not meant to be exhaustive, nor a wizard, but is a useful starting point for making informative and meaningful data visualisations
https://ft-interactive.github.io/visual-vocabulary/
https://public.tableau.com/app/profile/andy.kriebel/viz/VisualVocabulary/VisualVocabulary (Tableau Public)
https://raw.githubusercontent.com/Financial-Times/chart-doctor/main/visual-vocabulary/Visual-vocabulary-JP.pdf (Japanese)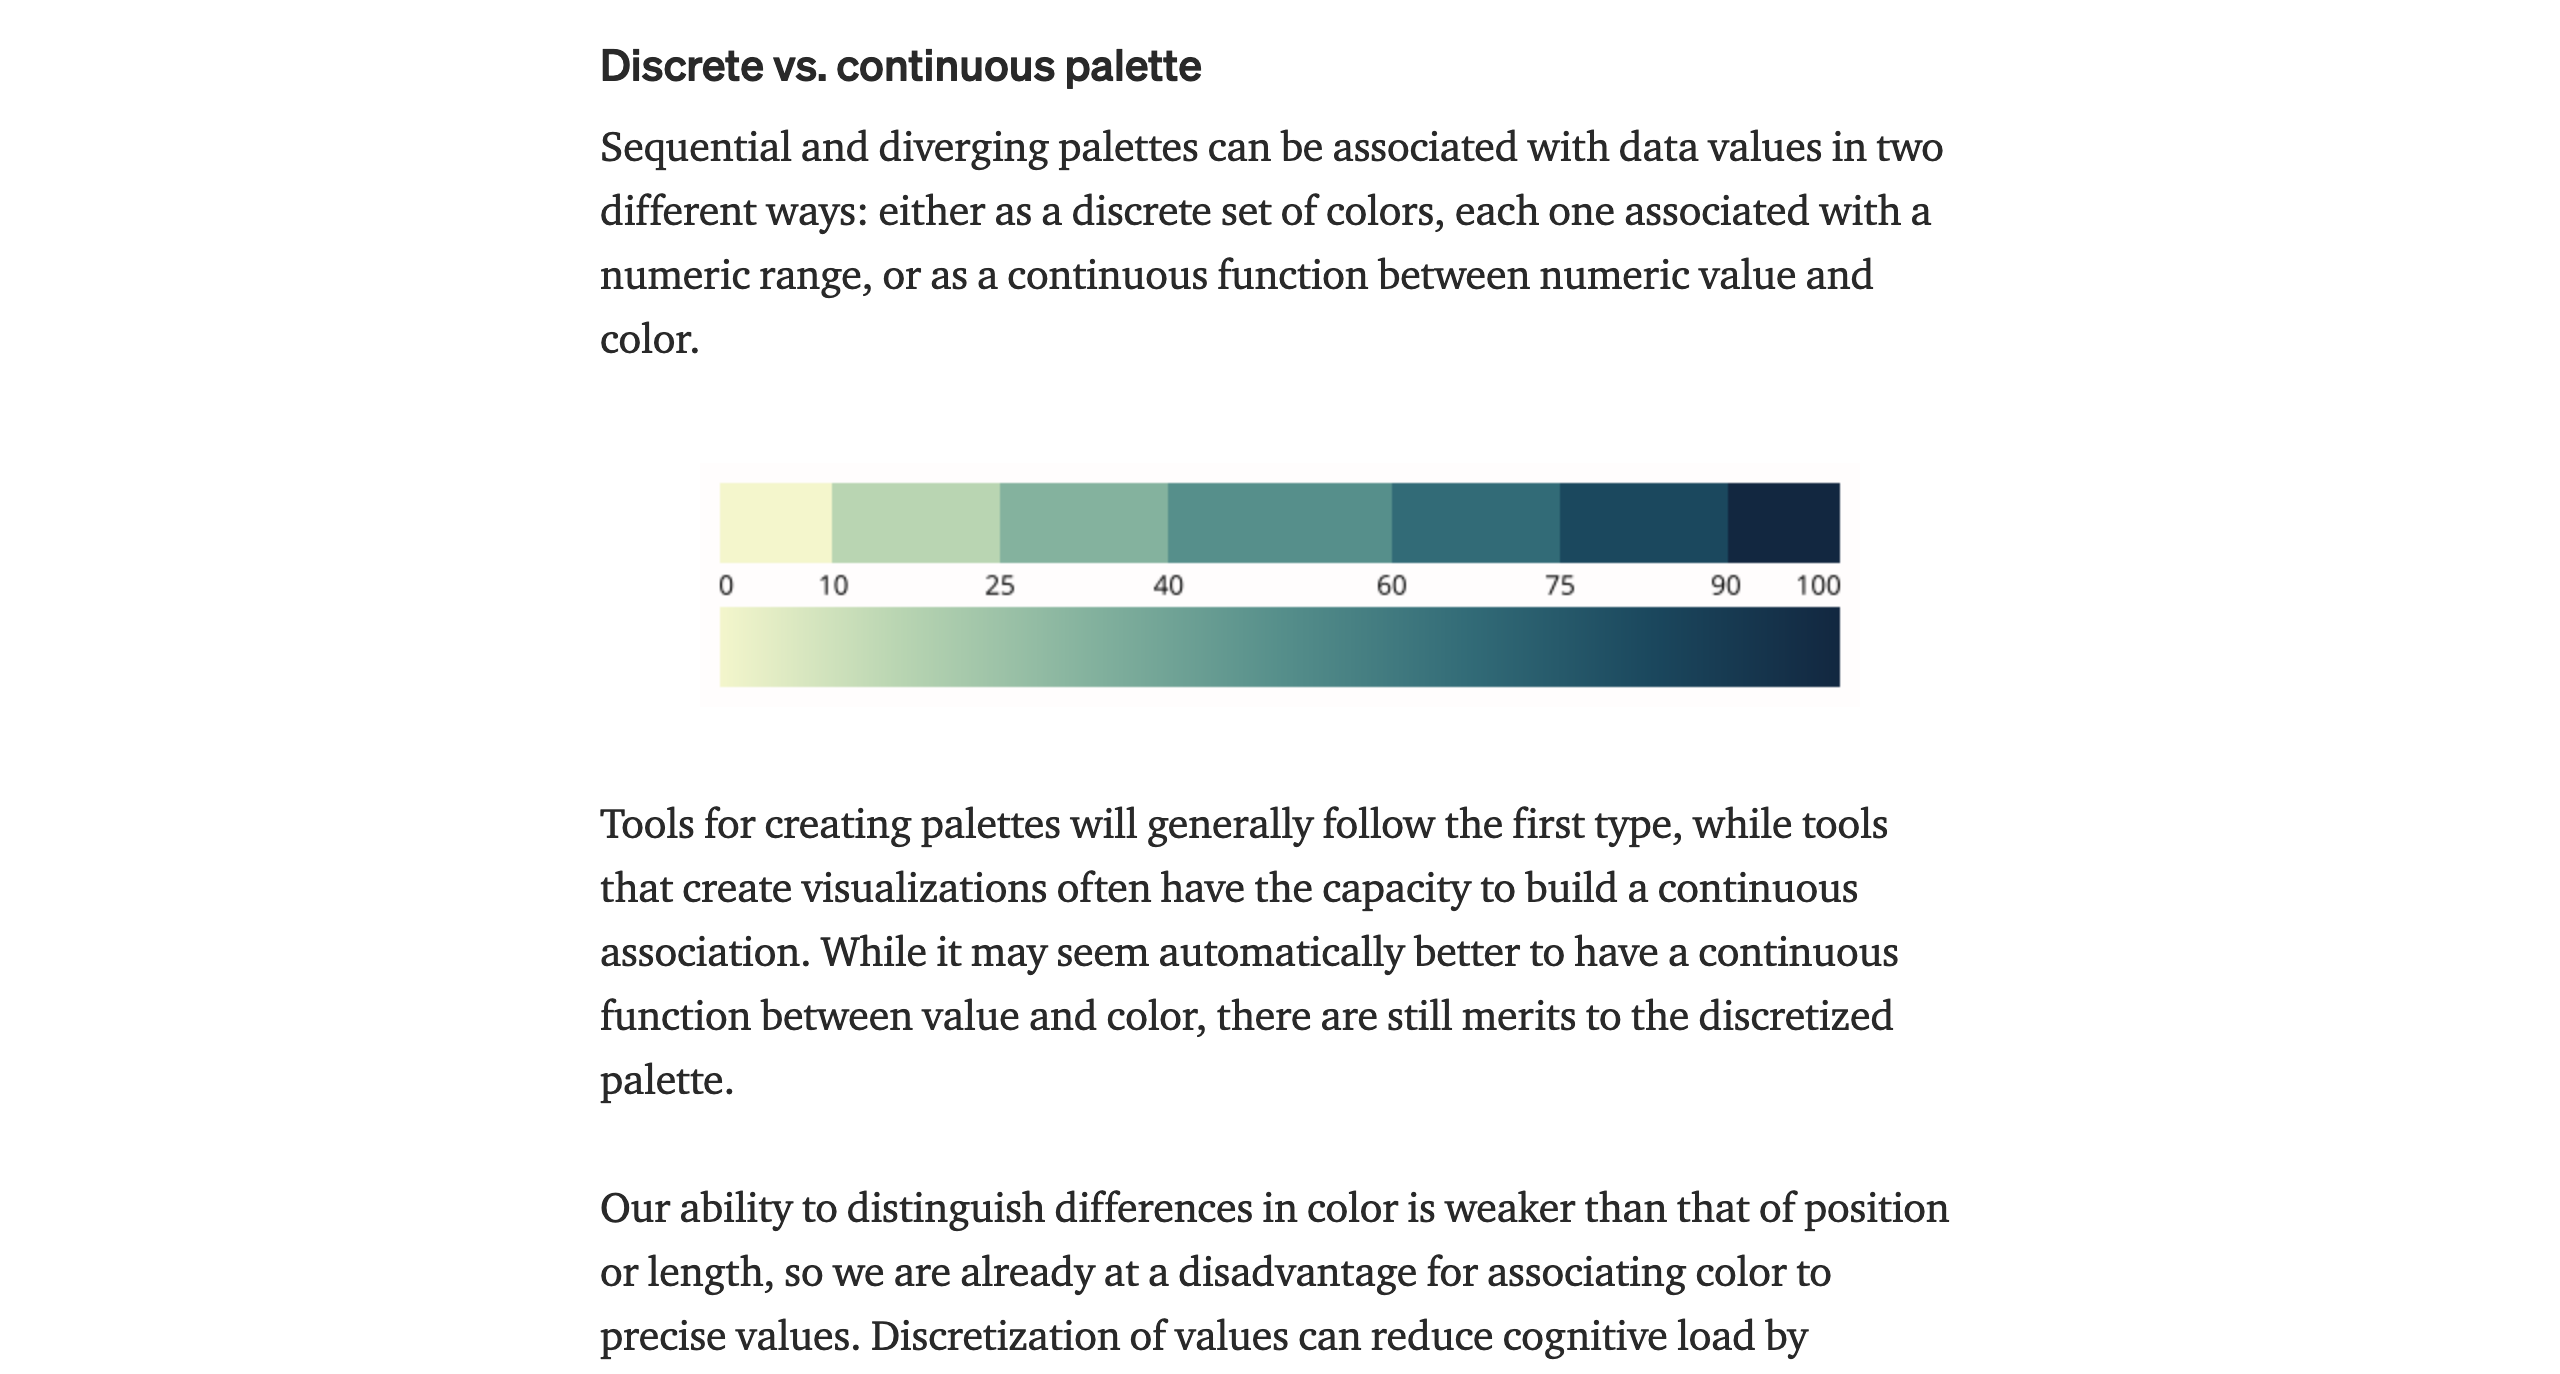
How to Choose the Colors for Your Data Visualizations
We know color is critical in data viz, but how are you supposed to know which ones to use?
https://medium.com/nightingale/how-to-choose-the-colors-for-your-data-visualizations-50b2557fa335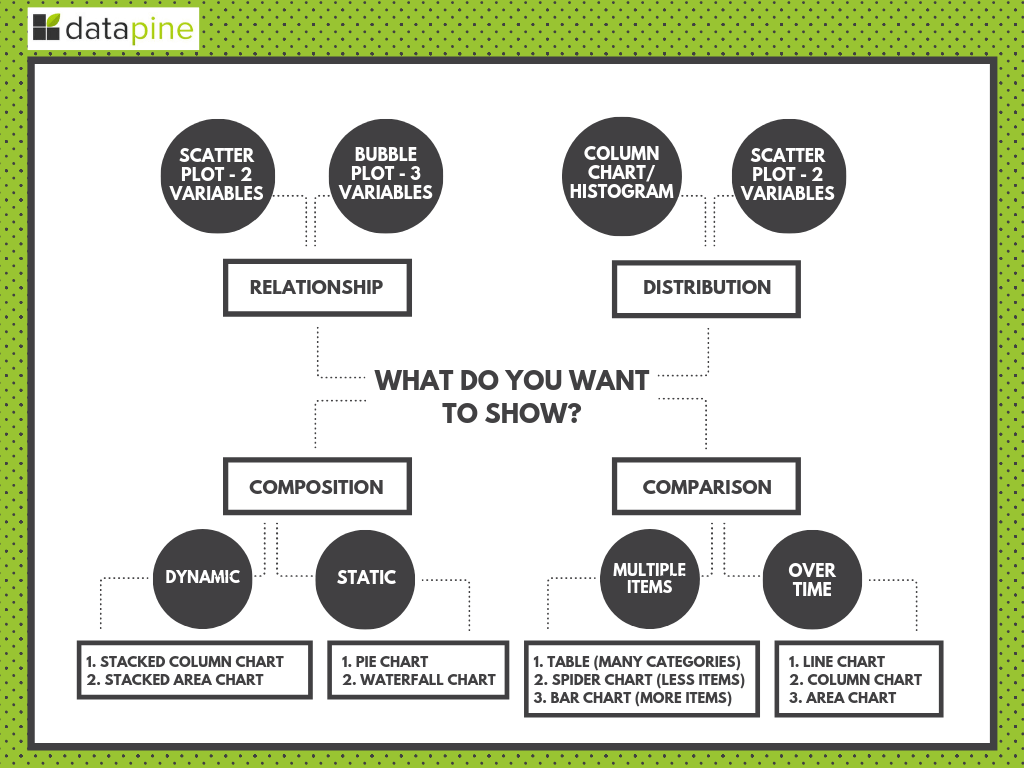
Choosing The Right Data Visualization Types To Present Data
Using different types of charts and graphs will tell different stories. Learn more about the top 12 data visualization types and when to use them.
This is rather a step-by-step learning material than a handy guide. What to avoid in each step is worth reading.
https://www.datapine.com/blog/how-to-choose-the-right-data-visualization-types/
Tweet